

Introduction
Exploratory Data Analysis(EDA), is described as a critical process in data analysis that involves initial investigations to discover patterns, and anomalies, and draw insights from the data through summary statistics and graphical representations. EDA is crucial in data analysis because it provides foundational insights and informs subsequent analytical decisions. It is the first step in uncovering the hidden patterns, anomalies, and relationships within the data, also considered as ‘groundwork’ for more advanced analysis and modeling techniques. EDA embodies a philosophical mindset and an artistic approach to thoroughly explore every nuance within the dataset from the very beginning. Principally developed by John Wilder in 1970, the idea behind the exploratory data analysis technique is to observe and extract insights from data before applying some prediction models.
Aspects of EDA
Data Understanding
This initial step entails becoming familiar with the dataset, its structure, and the significance of each variable. Activities include examining the data types, identifying any missing values, and understanding the context in which the data was gathered.
Data Preparation
During this phase, the data is cleansed and modified to prepare it for analysis. Tasks may involve addressing missing values, eliminating duplicate entries, standardizing data formats, and converting categorical variables into a suitable format.
Summary Statistics
Summary statistics provide a broad overview of the dataset’s characteristics. This encompasses metrics such as the mean, median, mode, standard deviation, range, and various percentiles for numerical variables, along with frequency distributions for categorical variables.
Data Visualization
Utilizing data visualization techniques helps in comprehending the distribution, patterns, and relationships within the dataset. This includes generating visual representations such as histograms, scatter plots, box plots, and heat maps to facilitate data interpretation.
Feature Understanding
This aspect centers on understanding the individual features or variables within the dataset. It involves analyzing the distribution of each feature, detecting any outliers, and evaluating their relevance to the analysis objectives.
Feature Relationship
Understanding the relationships between different features is essential for deriving insights from the data. This entails exploring correlations, associations, and dependencies among pairs or groups of variables, which can be visualized using techniques like correlation matrices or scatter plots.
Tutorial
Now, let’s delve into a step-by-step tutorial detailing how to conduct exploratory data analysis on a dataset. The dataset we are looking at is the California housing dataset. The dataset can be found on Kaggle. https://www.kaggle.com/datasets/camnugent/california-housing-prices
Importing modules
The first step in every data analysis process is to import the necessary modules. Pandas, numpy, matplotlib, and seaborn are Python modules used in data manipulation and visualization.
Reading the data set

We read the dataset using pandas’ ‘read_csv’ method and view the shape of the data frame (rows, columns).
Data Understanding
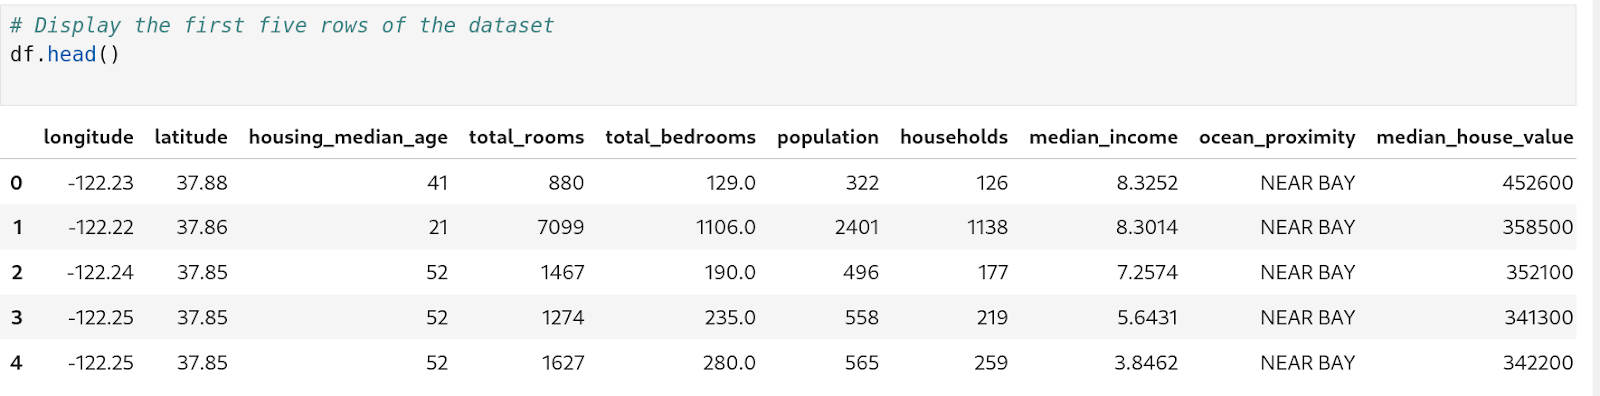
We have printed out the top five rows using the ‘.head()’ method to display the top 5 rows of the data frame.
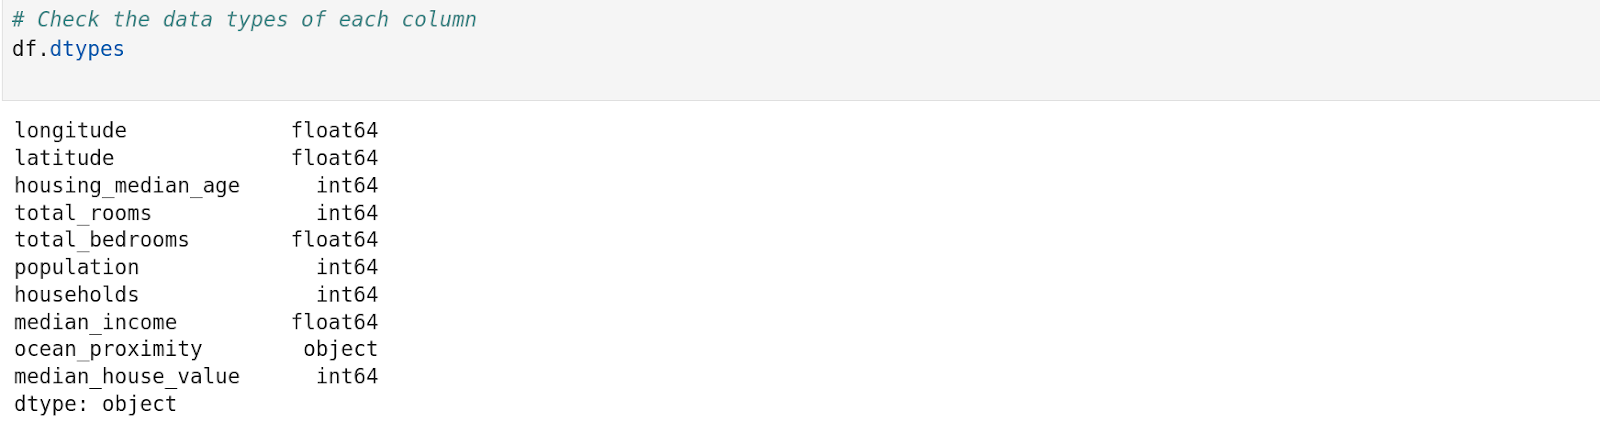
‘.dtypes’ to view the data type of each column. Above, we can see the column ‘ocean_proximity’ has the data type ‘object’ and every other column has numerical data type.
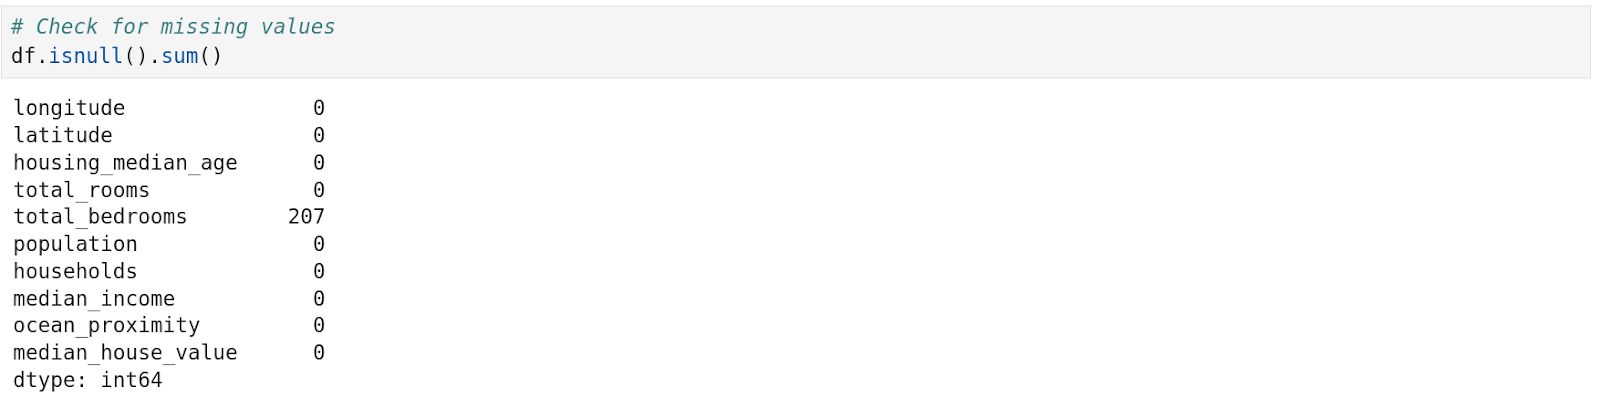
‘.isnull().sum()’ to view the presence of a null value in all the columns. We can see that the column ‘total_bedrooms’ has 207 null values present in it.
Data Preparation
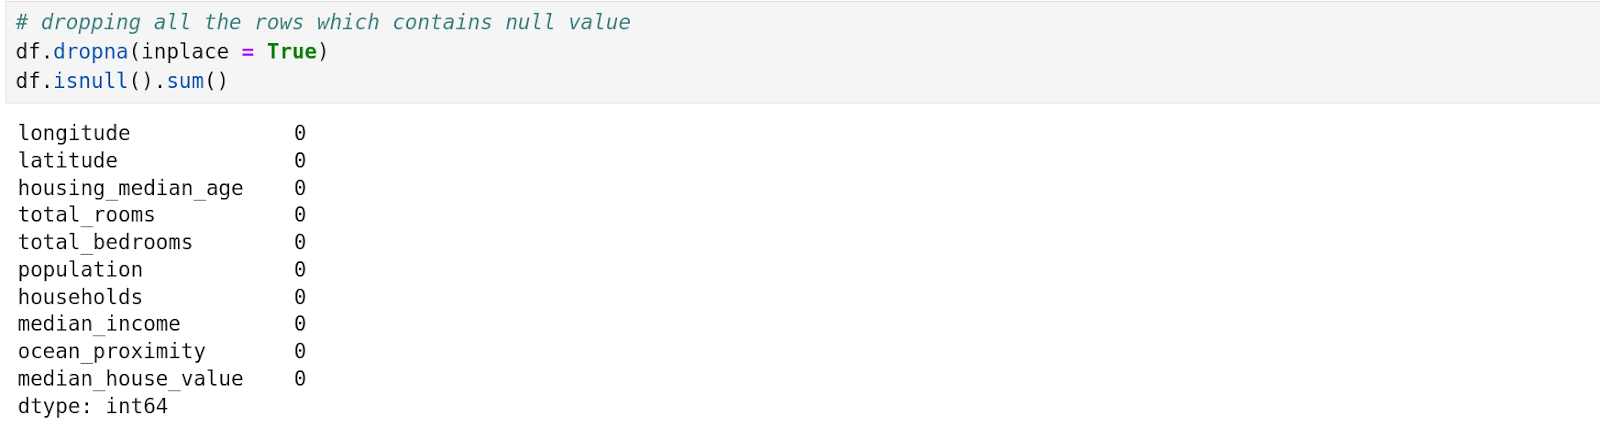
With ‘.dropna(inplace=True)’, we can delete every row which contains a null value and save it in the ‘df’ (data variable) itself.
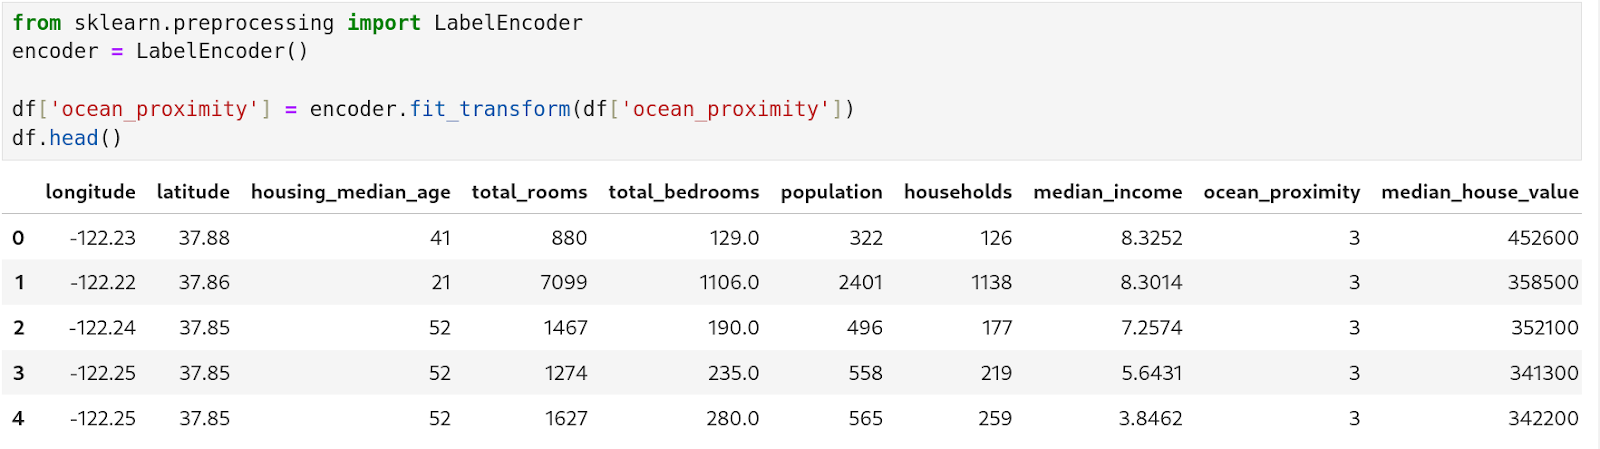
Here, we have used scikit-learn’s Label Encoder module to encode the values of the ‘ocean proximity’ to numeric form. To train different machine learning models on the dataset, it is necessary to encode all the relevant values into numeric form.
Summary Statistics
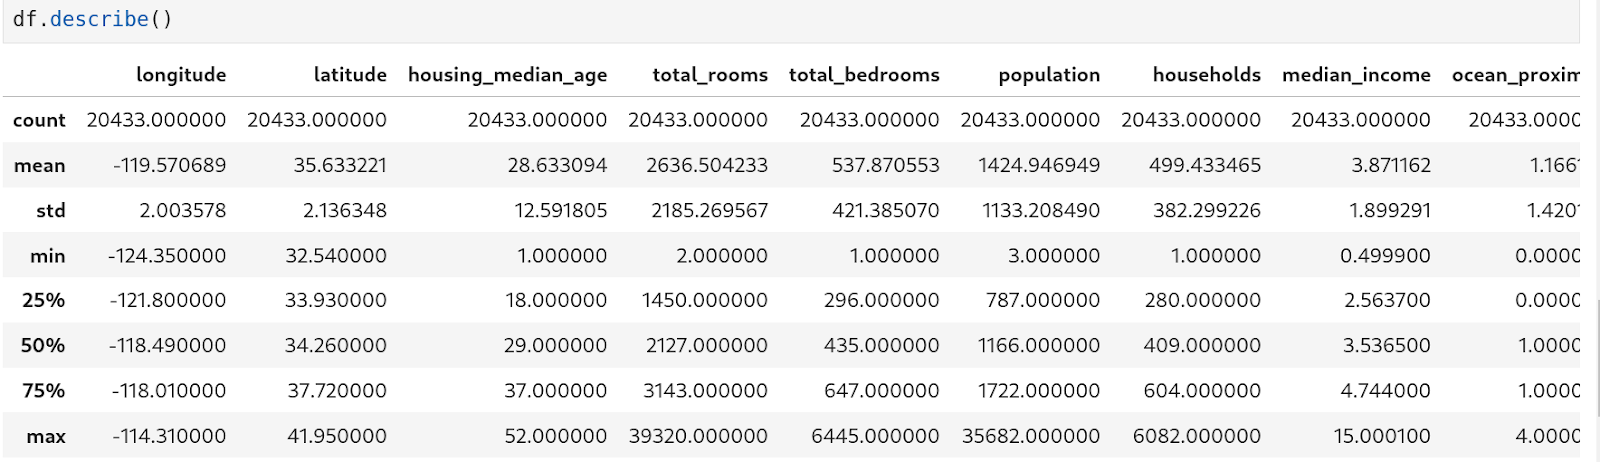
We can get the summary statistics for each feature (columns) with ‘.describe()’. We can get the statistical features such as mean, standard deviation, and more about all the numerical features present in our dataset.
Data Visualization
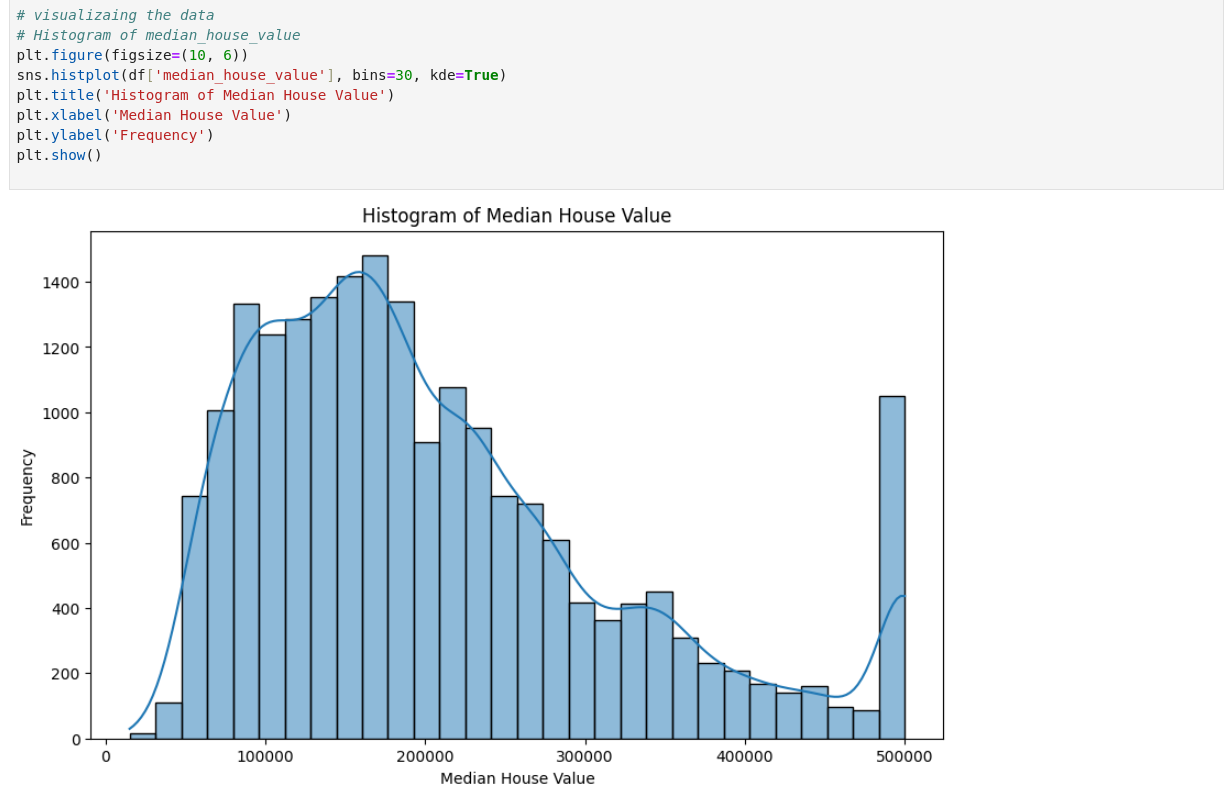
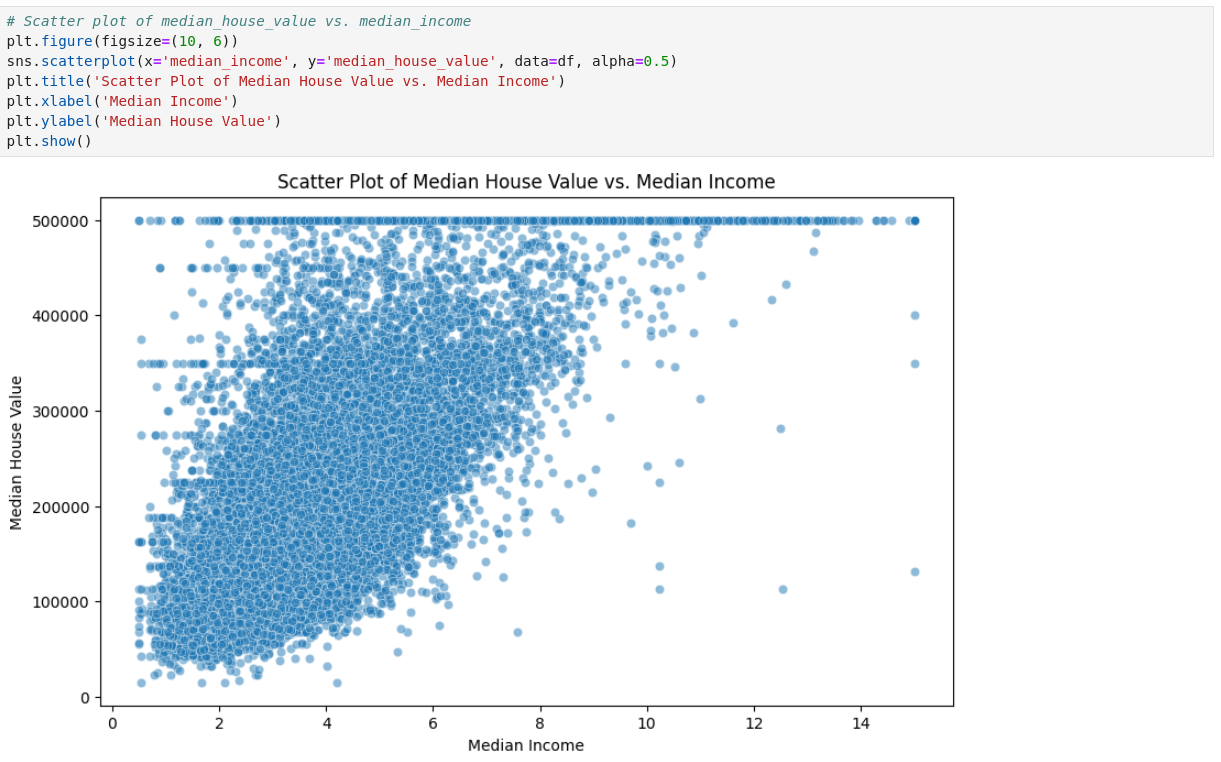
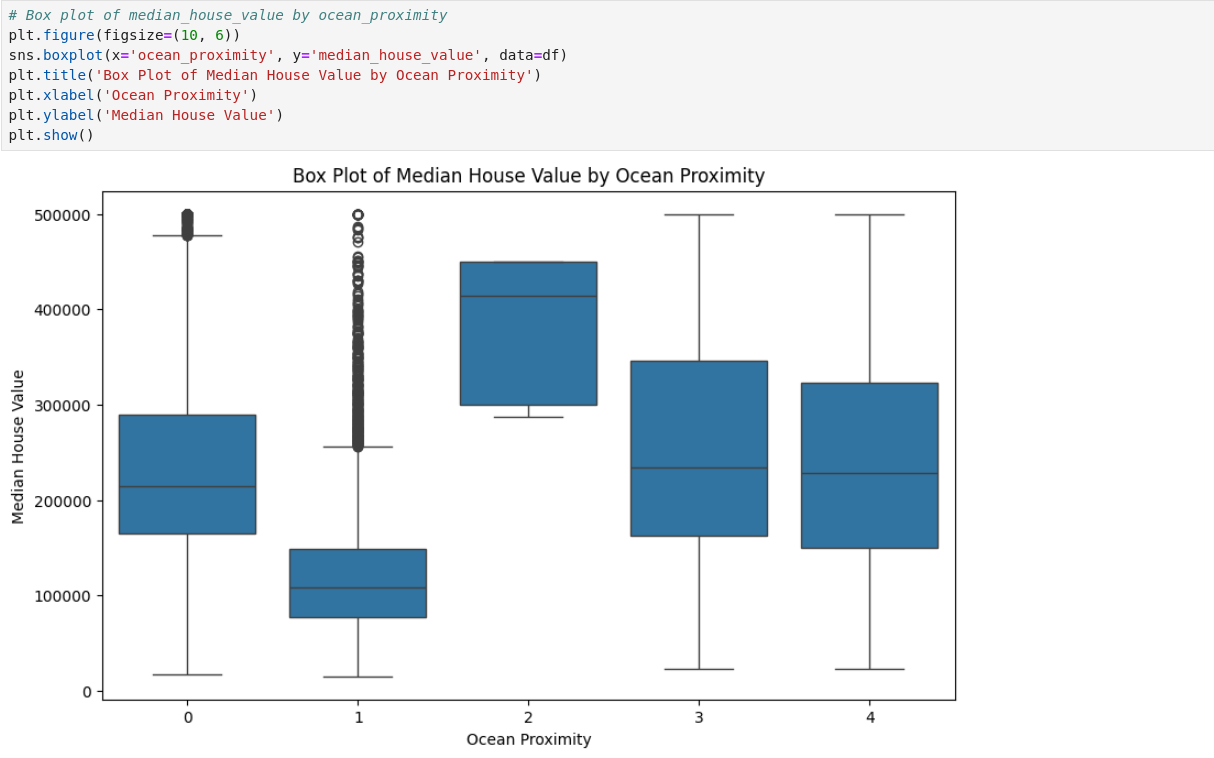
Above, we have visualized certain features of data using histogram, scatterplot, and boxplot respectively. We can understand the data better through this visualization process as it helps to identify trends, outliers, and relationships within the data.
Feature Understanding
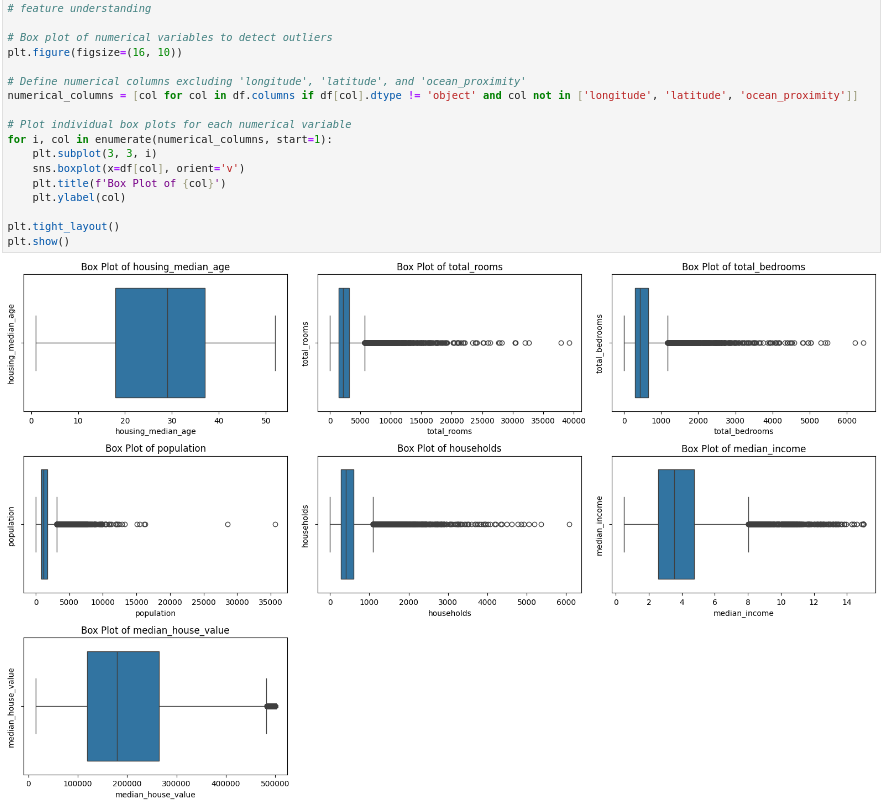
Above, we have used a loop to print out a boxplot for every numerical feature.
By examining these boxplots, we can quickly assess the central tendency, spread, and variability of each feature, as well as identify potential outliers or unusual data points which aids in understanding the data better and decision-making.
Feature Relationship
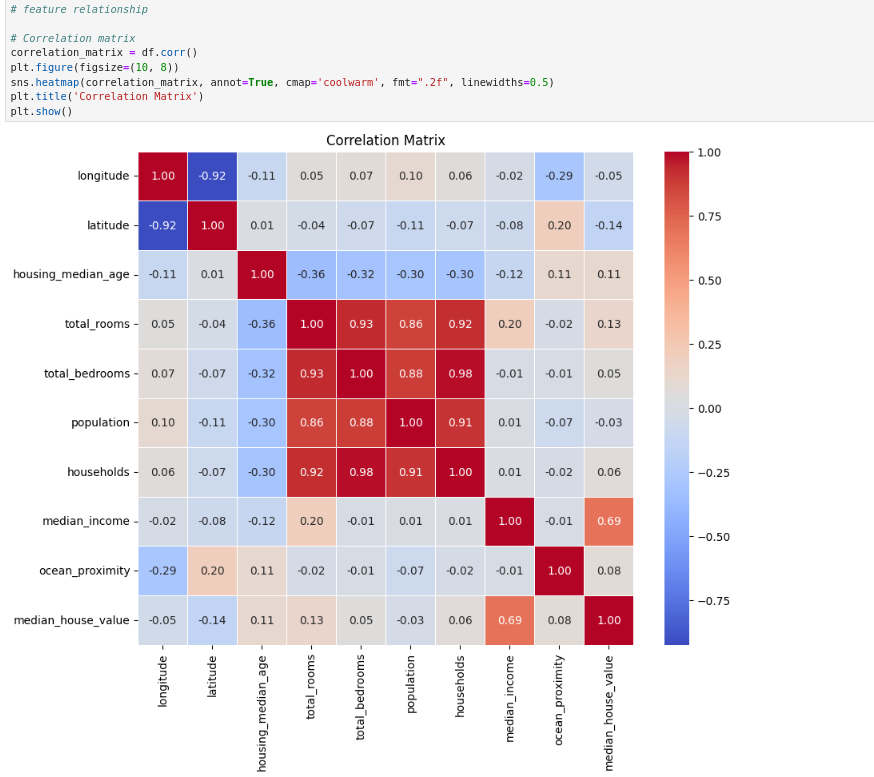
Here, we have used the ‘.corr()’ method to print out the correlation matrix for the given dataset. We can gain insights into the relationships between different features. By examining the correlation matrix, we can pinpoint which features are positively, negatively, or not correlated.
Conclusion
In conclusion, exploratory data analysis(EDA) is a crucial step in the data analysis process, providing valuable insights into the data through semantic exploration of the data using various techniques. With the steps we performed above, the basic process of exploratory data analysis has been covered. Although several things can still be done to improve the usability of the data in various modeling techniques, our data is ready to be fed into different machine-learning models.