
Note: The downloadable pdf report is at the bottom section of this blog
1. Introduction
Neurological problem Parkinson’s disease mostly affects the brain’s motor functions. Drugs may
help Parkinson’s disease sufferers feel better despite the fact that there is no cure. If the condition
is discovered at an advanced stage, there is no treatment. Parkinson’s disease, which alters the
stride and posture and raises the risk of falling, is more common among the elderly.
Parkinson’s disease does not yet have a definitive checkup analysis, and the incidence of
carelessness is high, particularly when a non-specialist made the diagnosis: the probability of a
mistaken result may be more than 20%. Key clinical aspects, such as shaking type, bradykinesia
and stiffness, should be thoroughly evaluated to boost diagnosis accuracy, however physician
subjectiveness may alter these findings(Cigdem & Demirel, 2018). It’s exciting to see how medical
decision support tools can improve objectivity and help with early diagnosis. Early detection of
Parkinson’s disease may lead to the development of individualized treatment options for those who
are infected. Detection of Parkinson’s disease relies heavily on the processing of speech, with
longer vowel-like sounds and regular speech being used to make the diagnosis. Motion and gait
may also be used to identify and monitor movement complaints in patients (Gil-Martin, et al.,
2019). Computer-assisted diagnostics have gained a lot of attention for this reason. With the use
of artificial intelligence (AI), healthcare providers may get better diagnostic tools and cut their
costs at the same time.
2. Aims
This report aims to know how Parkinson’s disease can be detected in early-stage as there is no cure
in an advanced stage.
3. Objectives
i. To enhance the detection of Parkinson’s disease in patients (PD).
ii. To provide a recommendation to treat patients accordingly to healthcare individuals.
iii. Various machine learning algorithms like CNN, SVMs, etc. will be viewed for detecting
disease.
iv. Mobile and Desktop applications will be developed for detecting Parkinson’s disease.
4. Literature Review
4.1 Dynamically enhanced static handwriting representation for Parkinson’s disease detection
Parkinson’s disease may be diagnosed by a person’s handwriting, which is a kind of movement
function of the brain that changes in writing from normal handwriting (PD). When an image is
sent into a Convolutional Neural Network (ConvNet/CNN), the algorithm assigns weights and
biases (learnable) to distinct parts of the image, and can distinguish between them.
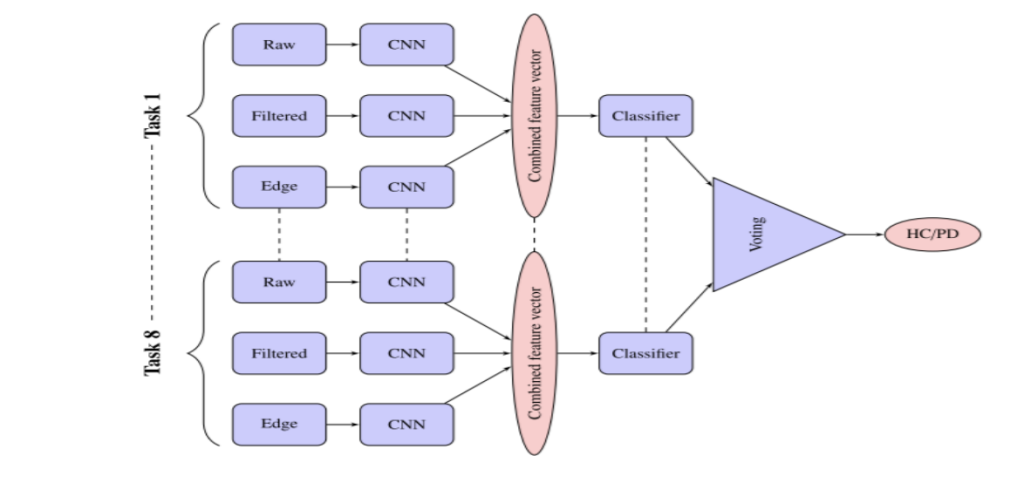
Figure 1 CNN classification workflow
One feature per task is created from the CNN features, which are then fed into a traditional machine
learning algorithm for further processing. (Diaz, et al., 2019) analyzed data from both Parkinson’s
patients and healthy people in the PaHaW dataset using the VGG16 architecture (Diaz, et al.,
2019). Using the ImageNet dataset, this is a well-known and commonly used CNN architecture.
Convolutional base (up to block5 pool) was run on each input photo from the PaHaW dataset to
accomplish transfer learning, removing the linked layers above the network that do categorization.
The Keras-enabled VGG16 model was used in this study. It was first reduced to 150×150 pixels
and then transformed into RGB before being used in the CNN model. Static, dynamic, and a variety
of other handwriting traits are used to determine the accuracy of the feature extraction, dynamically
enhanced static handwriting (velocity) (velocity and air). The dynamic handwriting function (i.e.,
on-line writing) has the highest accuracy of 88.67 percent (i.e. on-line writing). There have been
significant findings in the area of on-line processing of preprocessed handwriting by Parkinson’s
sufferers (Diaz, et al., 2019).
4.2 Detecting Parkinson’s disease with sustained phonation and speech signals
using machine learning techniques
As far as Lithuanian pronunciation is concerned, just one short sentence has to be considered in
the context of phonation rather than speech. An acoustic cardioid (AC) and a smartphone (SP)
were used to record the activity, allowing for an evaluation of the performance of different
microphones. Five performance measures were used to evaluate categorization performance:
EER, AUC, Accuracy, Specificity, and Sensitivity. Both phonation and speech tasks provided
the data for this study, which was then divided into two distinct categories (Almeida, et al., 2019).
(Almeida, et al., 2019) proposed technique is based on motor symptoms that are uniquely related
to the vocal tract. There are two steps to this procedure shown in Fig. 2. Step 1: Two vocal
responsibilities (see Fig. 2). Phonation and speech, or vowel voicing and phrase pronunciation, are
examples of vocal tasks. The voice signal collecting device is the second step. So that they may
evaluate the classifiers on AC and SP audio data. Audio signals from the previous phase are
preprocessed in step 3. It is possible to create voiced and unvoiced files using the Praat Software
Toolbox. The feature extraction process resulted in the creation of additional files for each feature
set and modality. A total of 144 files were extracted. With the help of a hold-out technique, you
may evaluate the database and four classifiers. Hyper-parameters for k-Nearest Neighbour
(kNN), MLP, OPF, and SVM were improved using this method. One of the most fundamental
Supervised Learning strategies is K-Nearest Neighbor. If a new case/data is similar to an existing
one, the K-NN algorithm puts it in the most similar category. A neural network with nonlinear
input-output mapping is known as a multilayer perceptron (MLP). In a multilayer perceptron,
neurons are stacked on top of one another in hidden layers. It is possible to attain high identification
rates and low processing costs by using the Optimum-Path Forest (OPF) algorithm. SVMs were
faster at training than OPF, although OPF was slower in classification. Outlier detection and
classification are two of the most common uses of SVMs. There are many advantages of using
SVMs: When the number of dimensions exceeds the number of samples, it is useful in high-
dimensional contexts.
The toolbox was used to train the three models, with the default hyper-parameters applied. The
SVM classifier used three distinct kernels to classify the data.. Back-propagation was used to train
the MLP, which includes hidden units ranging from 1 to 50. In order to train OPF, distance
measurements were used. EER and Accuracy measures were used in step 6 to choose the best
extractor and classifier combination. ROC and DET curves were used to determine AUC and EER
(EER). Extraction and Classification Ratios (FNR and FPR) were balanced using the EER, which
was used for two purposes: (FPR). A confusion matrix had been utilized to classify the data.