
1. Introduction
1.1. Project Briefing
1.1.1. Project Introduction
Traffic sign recognition is a web app that helps in recognizing and classifying traffic signs. While traveling, we can see several types of traffic signs that are placed beside the road or at some certain height. So recognizing some traffic signs is easy but some may create problems. Therefore an individual can click that image and upload it to the system for recognition of that particular name of the traffic sign. This will improve the safe driving practices and may the accidents decrease.
The intends to establish a procedure that can detect and categorize road and traffic signs to produce a tally that will allow transportation authorities to renovate and keep up to date traffic signs. It operates by capturing shots by using a camera and uploading recorded shots i.e., images to the system and the system used the AI model to recognize and classify the traffic signs.
1.1.2. Problem Statement
Given humans’ limited ability to recognize and comprehend objects, developing a computer-based system that can assist people in their daily lives is a difficult task. Many factors change over time, such as luminance and visibility, and are easily handled by human identification systems but pose severe challenges for computer-based recognition. Looking at the problem of recognizing road and traffic signs reveals that the aim is well stated and appears to be a straightforward problem. Traffic or Road signs are placed in convenient locations, have standard shapes, colors, pictograms, and are well-known. However, several parameters that influence the detecting system’s performance must be thoroughly investigated to comprehend the problem completely. Furthermore, traffic signs may be partially or entirely obscured by other things such as automobiles or pedestrians in these
photographs. Other issues, such as the existence of similar-looking objects to road signs, such as buildings or billboards, can wreak havoc on the system and make sign detection difficult.
Different countries utilize a variety of colors and pictograms in traffic signs. In addition, the system should be adaptable, which means it should allow for ongoing learning rather than having to redo the training for each country. Finally, traffic sign recognition should be given many sign examples to address all of these issues so that the system can respond appropriately when a traffic sign is met.
1.1.3. Description of System
A system for recognizing road and traffic signs should operate in two modes: the training mode, which involves collecting a set of traffic signs for training and validation, and the prediction model, which consists of the system recognizing a traffic sign that has never been seen before. It comprises many modules that work together to execute this task. These modules are camera, colour segmentation, shape analysis, raw image datasets, feature extraction, and classification. Colour segmentation, recognition, and classification are the three main stages of the system.
The traffic system used a convolutional neural network (CNN) to classify the data. The categorization is done in two stages: first, the rim’s shape is classified, and then the sign’s contents are classified. Binary pictures and five distinct types of moments were used to train and test the classifier. Different features, kernels, parameters, and moment’s orders were used to test the CNN performance. The performance rate is around 97 percent on average.
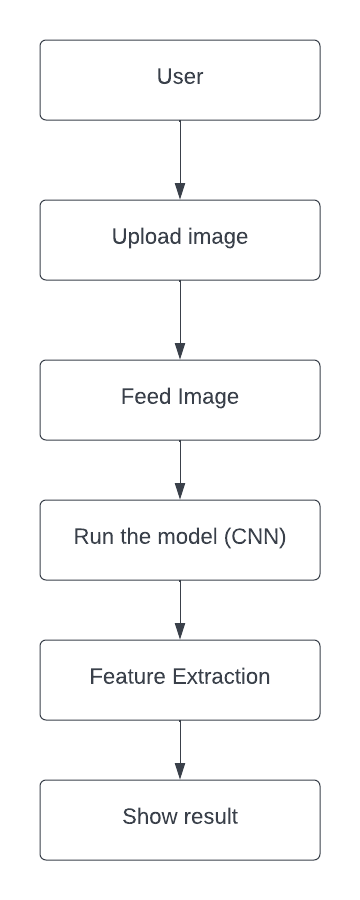
Figure 1 System Architecture
1.1.4. Nepal traffic and road Signs
Road and traffic signs regulate, warn, guide, or educate road users. They improve road traffic quality and safety by ensuring an orderly and logical flow of all traffic, including pedestrians.
Traffic and road signs are intended to be easily recognized by drivers due to their distinct designs and colours.
Nepalese road signs are divided into five groups:
1.1.4.1. Warning Signs
It is generally an equilateral triangle in shape signs with red colour on the border. This sign is placed to warn drivers of the different difficult situations on road.
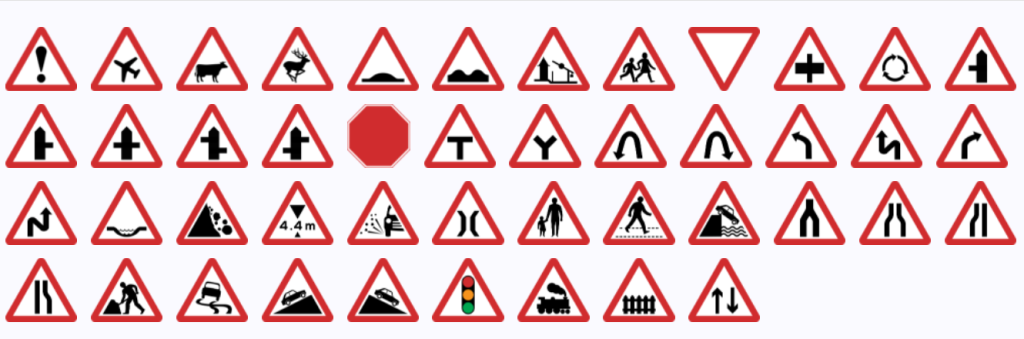
Figure 2 Warning Signs (Traffic-Rules, 2022)
1.1.4.2. Prohibitory Signs
Prohibitory traffic signs are generally circles in shape with a thick red colour border around them. This sign generally indicates certain tasks or work that is prohibited for road users.
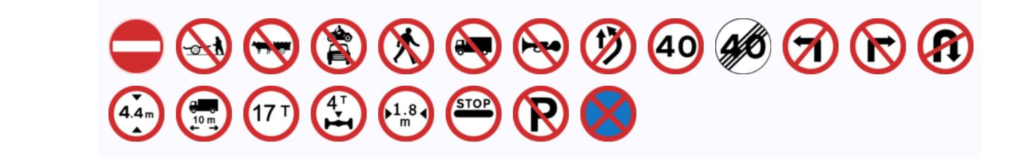
Figure 3 Prohibitory Signs (Traffic-Rules, 2022)
1.1.4.3. Mandatory Signs
A mandatory sign is characterized by a blue circle having some arrows which are used to control the actions of road users.
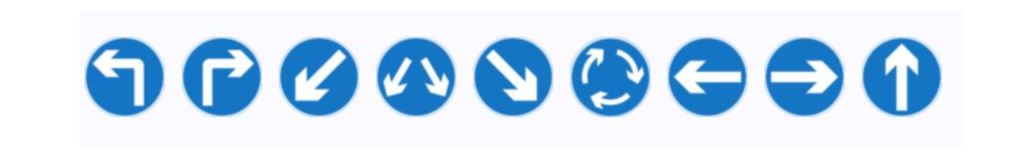
Figure 4 Mandatory Signs (Traffic-Rules, 2022)
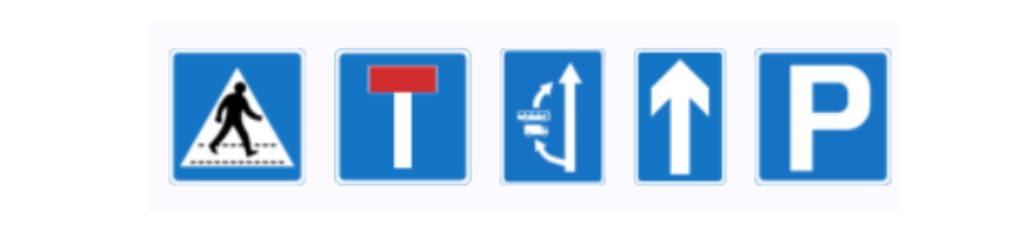
1.1.4.4. Information Signs
Information signs give additional information about the start or end of some kind of traffic situation.
Figure 5 Information Signs (Traffic-Rules, 2022)
1.1.4.5. Priority Signs
Priority signs carry the information about the priority rule i.e., who should be given priority and who has priority.
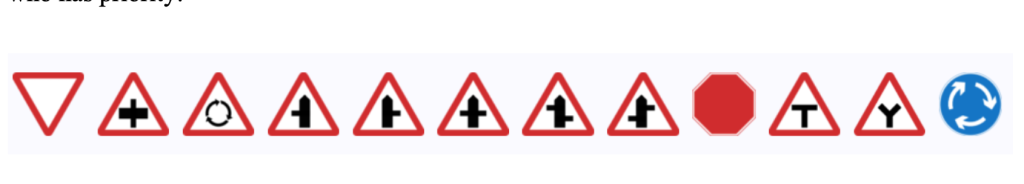
Figure 6 Priority Signs (Traffic-Rules, 2022)
1.1.5. Standard Colours and meaning of colours used for traffic signs
There are different colours used in traffic signs and each colour has its significance and meaning. Every colour has its code. The different colours with their meaning and standard colour code are shown in the table.
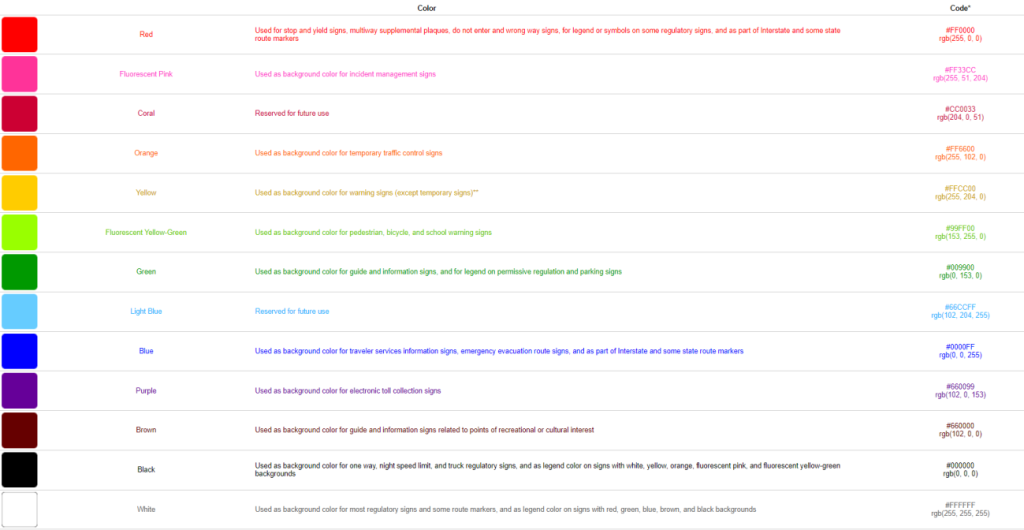
Table 1 Standard Colour code and their meaning (Moeur’s, 2019)
In the above-mentioned table, we can see that there are different colours such as Red, Blue, Green, Coral, etc have their meaning and colours code. These types of colours and their code are generally used for making several types of traffic signs.
1.1.6. Shapes of traffic signs and their meaning
While recognizing traffic signs, the shapes of traffic signs play an important role. The different shapes are so we can recognize certain traffic signs instantly, without having to read them. For example, when you see an eight-sided traffic sign, you know it’s a stop sign and you must stop, even if there is some reason you can’t read it (or you don’t have the time).
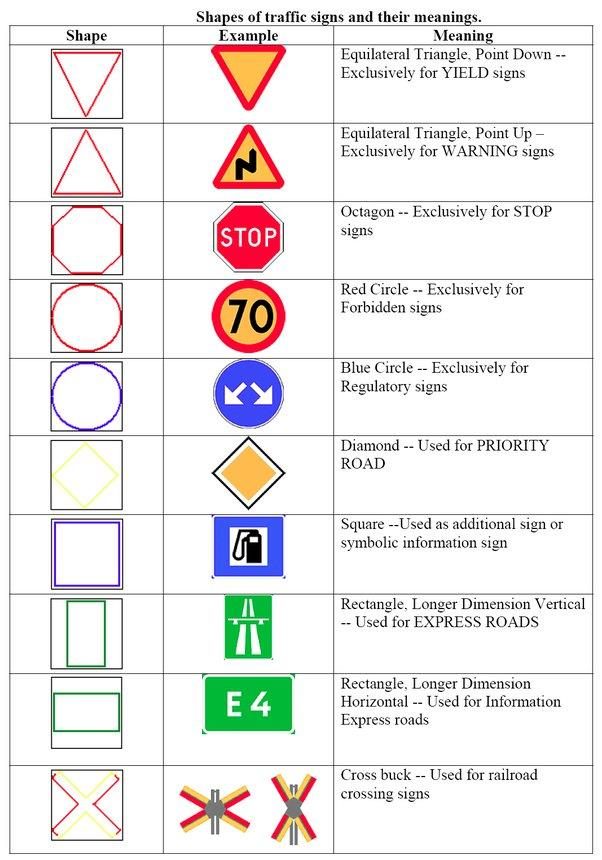
Table 2 Shapes of the traffic sign and their meaning
1.1.7. Possible Difficulties
The environment of the road and its surrounding scenes are very complex. Some road signs are found in a severe conditions such as damaged, aged, disoriented, etc. and such cases, there arises difficulty in recognizing traffic signs and even got wrong results and may face various challenges:
As a result of prolonged exposure to sunlight and the reaction of the paint with the air, the colour of the sign fades with time.
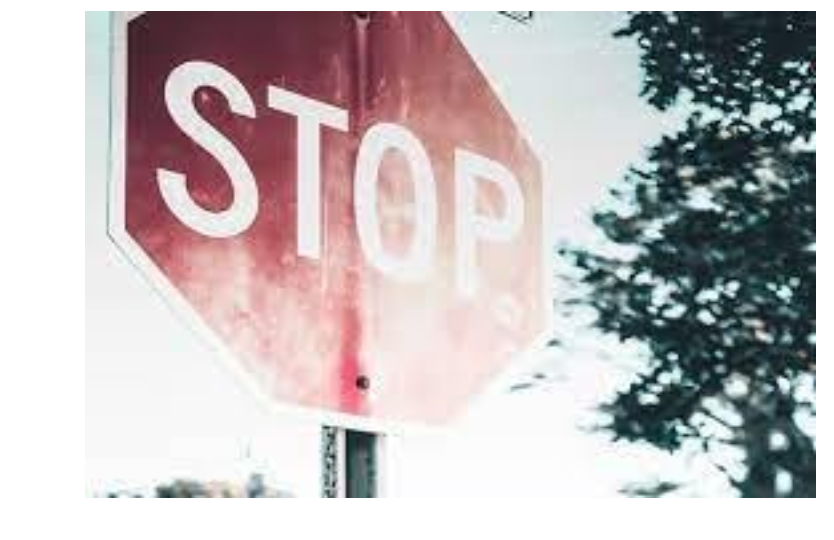
Figure 7 Faded Sign
Weather factors such as fog, rain, clouds, and snow have an impact on the visibility of traffic signs.
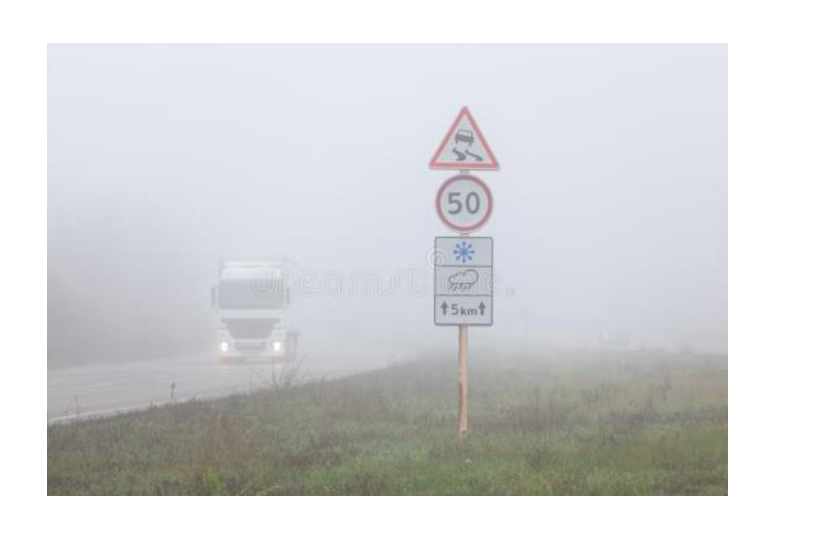
Figure 8 Bad weather
Variations in light circumstances, such as shadows, clouds, and the sun, have a significant impact on colour information. Illuminant colour (daylight), illumination geometry, and viewing geometry can all influence it.
1.1.8. AI Implementation
Several neural networks in the CNN family specialize in the processing of data that has value in matrix form like pixel by pixel, such as images, and are also known as CNNs or ConvNet. In a digital image, visual data is encoded in binary form. It contains matrix-like management of pixels with pixel values that specify the lightness and colour of each pixel. In most cases, convolutional neural networks are taught as supervised approaches, which means that the training data includes both the inputs (such as pictures in an image recognition task) and the labels (i.e. the objects portrayed in the photos).
1.1.8.1. Reason behind using CNN
An image’s patterns are the primary focus of CNN’s analysis tools. As it digs further, it finds the correct characteristics on its own, so we don’t have to offer them. Because of this, we turned to CNN whenever there was an issue with CNN. Convolutional networks are based on biology when it comes to how neurons link. Because of their shared-weights design, they are also known as shift- invariant. It’s distinct from MLP since CNN employs several different layers to recognize patterns in pictures fed into it. In contrast to CNN, which uses sparsely connected layers and receives a matrix as input, MLP utilizes densely linked layers (Liao, et al., 2019).
1.1.8.2. Working flow of CNN
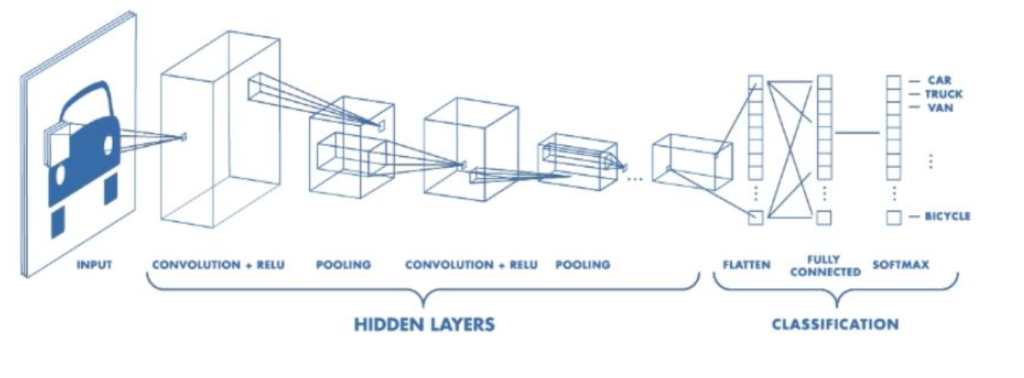
Figure 10 CNN architecture
A CNN generally includes 3 components: a convolutional layer, a pooling layer, and a fully connected layer.
Convolution layer
The convolution layer is the CNN’s core. It carries the bulk of the state’s computational load. Both the set of training data (kernels) and the limited section (perceptron) of the perceptron are linearly combined in this layer. The kernel is smaller in size and more detailed than an image. In a picture with three (RGB) portals, the module’s height and width are small, but the depth extends to all three-color channels.
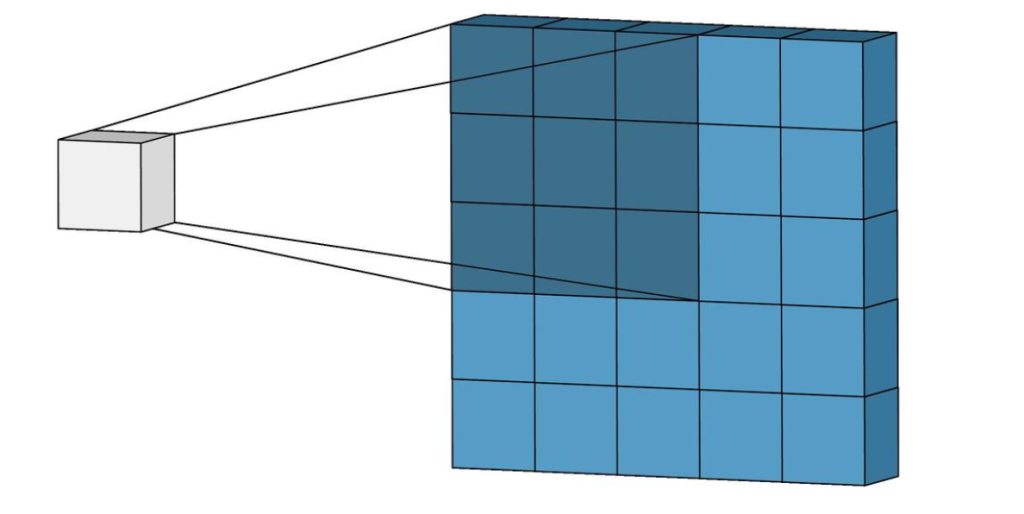
Figure 11 Convolutional layers illustrations
The kernel slides over the picture’s height and breadth during the forward pass, providing an image representation of the receptive region. An activation map depicts the kernel’s reaction to each spatial point in the picture. A stride is the kernel’s slow movement from one place to another.
W x W x D + Dout kernels with spatial size F, stride S, and padding P = output volume size
Size Wout + Dout + Dout + Dout will be the final output volume.
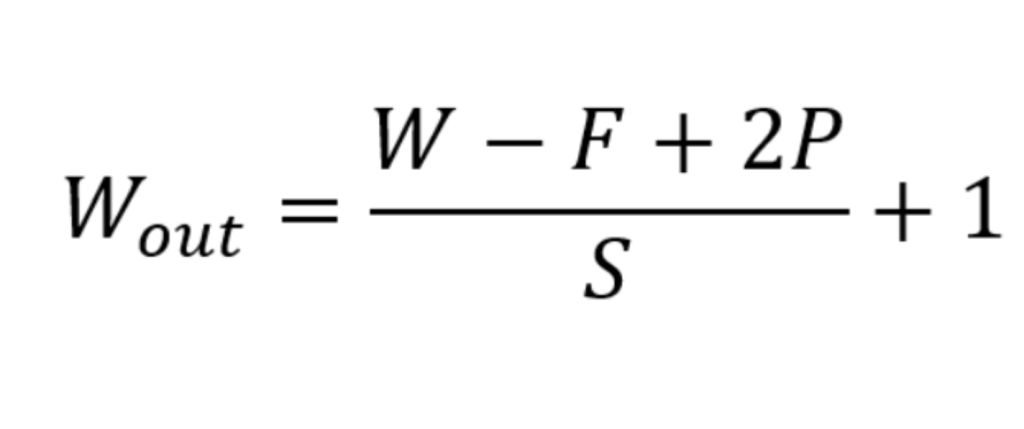
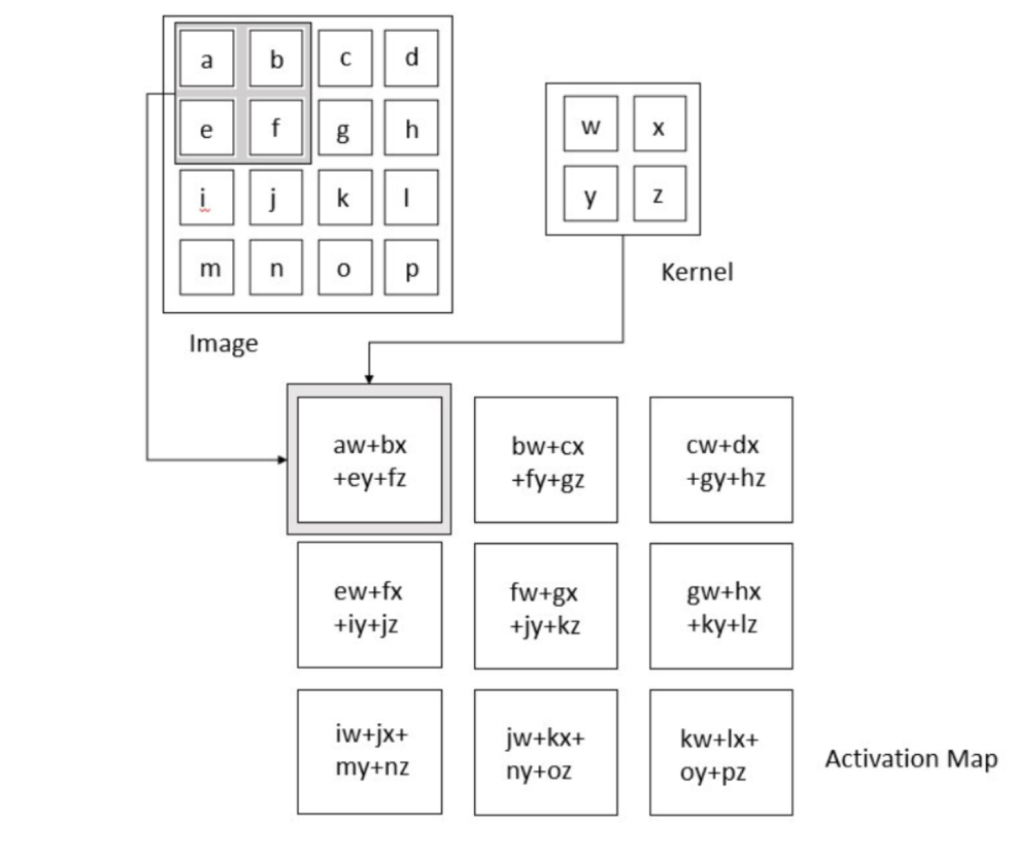
Figure 12 Operation of convolutional layer
Motivation Behind the convolution layer
Convolution employs three basic ideas that propelled machine vision investigators: sparse contact, present sample, and partition representation. Let’s analyze each one of them in depth.
Minimalist neural network layers utilize multiplications by a matrix of parameters indicating the link between the intake and outflow unit. This means that every transfer function interacts with every input unit. Therefore, convolution neural networks display sparse interaction. This is done by making the kernel smaller than the input e.g., an image may include millions or thousands of pixels, but when processing it using the kernel we may uncover useful information that is of tens or hundreds of pixels. This suggests that we need to maintain fewer parameters that not only minimize the memory use of the model but also boost the statistical efficacy of the model.
If calculating one feature at a spatial place (x1, y1) is advantageous then it should also be valued at some other geographical point say (x2, y2) (x2, y2) (x2, y2). It indicates that for a single double slice i.e., for creating one activation map, neurons are constrained to apply the same set of weights. In a typical neural network, each member of the weight matrix is utilized once and then never returns, however, a convolution network contains shared parameters i.e., for getting output, weights supplied to one input are the same as weight applied elsewhere.
Due to sampling being utilized to gather, the layers in the convolution neural network will have a property of equivariance to translation. It shows that if we updated the input in a method, the output would likewise be modified in much the same way.
Pooling Layers
Rather than relying on the network’s output, the pooling layer generates a statistical summary of the nearby outputs. As a result, the amount of computation and weights required for the representation are reduced. It is performed on each slice of the representation separately.
It is possible to calculate the average of the rectangle’s neighborhood, the L2 norm of the neighborhood, and a weighted average based on distance from the center pixel. Max pooling, on the other hand, is the most common method of reporting neighborhood output.
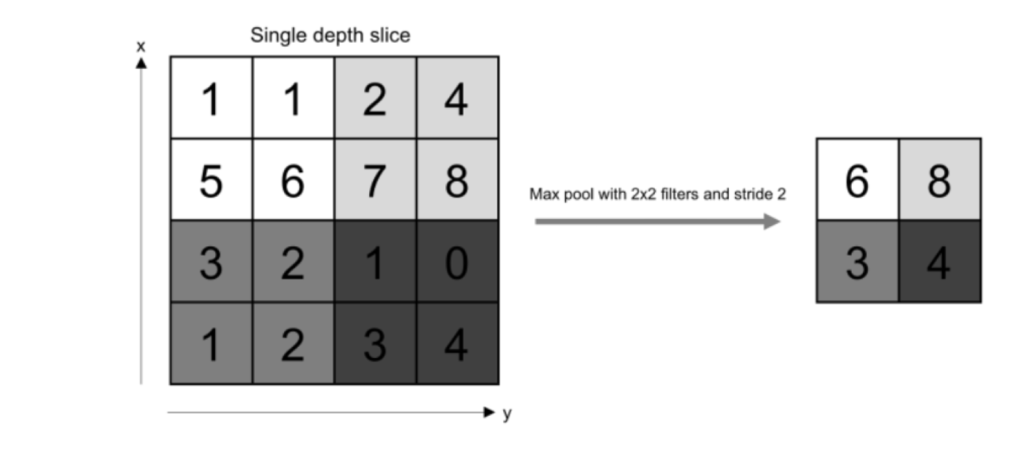
Figure 13 Operation of pooling
To calculate the output volume, we need to know the size of the activation map, the pooling kernel’s spatial size F, and the stride S.
In other words, this will produce an output volume with dimensions equal to (Wout + Wout + D).
Regardless of where an object appears on the frame in a pooled scene, it will be recognizable to the viewer.
Fully connected layers
Neurons in this layer exhibit complete connection with all neurons in the previous and following layer as demonstrated in normal FCNN. This is why it may be calculated as usual by a matrix

multiplication followed by a bias effect. The FC layer serves to map the representation between the input and the output.
Activation Function
Since convolution is a linear operation and pictures are far from linear, non-linearity layers are commonly inserted right after the convolutional layer to introduce non-linearity to the activation map.
ReLU
The Rectified Linear Unit (ReLU) has proven increasingly popular in the last few years. It computes the function ƒ(κ)=max (0,κ). In other words, the activation is essentially a threshold at zero. In comparison to sigmoid and tanh, ReLU is more trustworthy and accelerates the convergence by six times. Unfortunately, a drawback is that ReLU could be fragile throughout training. A huge gradient running across it may update it in such a way that the neuron will never be further updated. However, we may cope with this by creating the right learning rate.
We’ll flatten the picture into a column vector once it’s been transformed to a Multi-Level Perceptron-friendly format. Neural networks are trained using a feed-forward neural network with backpropagation done to every training iteration. The model can discriminate between dominant and specific low-level characteristics in pictures and categorize them using the Softmax Classification algorithm across a series of epochs.
1.2. Aims
- a) To explore a productive solution to help in understanding the name of different traffic signs using AI.
- b) To assign the detected traffic indicators to their appropriate sub-classes
- c) To develop a user-friendly web application.
1.3. Objectives
- a) Datasets of traffic signs will be collected through Kaggle to train AI models to recognize the name of traffic signs.
- b) A better understanding of the attributes of road and traffic signs will be developed with the help of TensorFlow, Keras library for image processing for the recognition challenge.
- c) Various machine learning models like Convolutional Neural Network(CNN) or Support Vector Machines(SVMs), etc. will be used to train the dataset.
- d) The best method for extracting features from traffic signs will be created.
- e) An image uploader will be generated to upload an image for further process of recognition.
- f) A web application will be created for tracking traffic sign inventory.
1.4. Artefact
When a system is developing, we have to divide the tasks into several groups, that group is collectively called artefact or subsystem. Dividing the system into subsystems will help in the development of a better version of the system.
1.4.1. Functional Decomposition Diagram
A functional decomposition diagram may break any function or project into smaller steps. There are several applications for functional decomposition, from business and industry to computer programming and artificial intelligence.
17
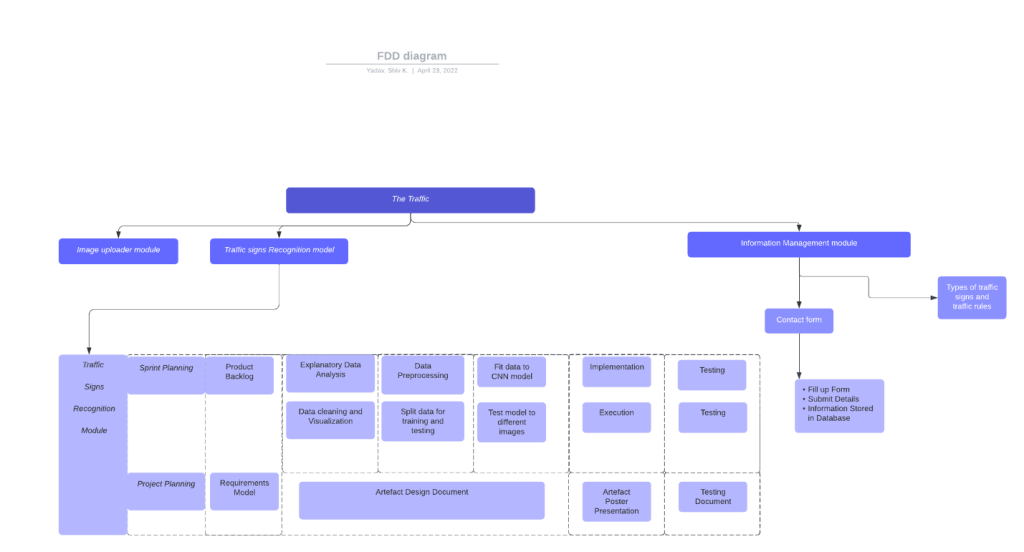
Figure 14 Functional Decomposition Diagram
1.4.2. System Explanation
Traffic signs recognition system, which helps in recognizing traffic signs. I have made this system so that everyone can use it. So it does not requires any user authentication. Users can go directly to the web page and see the instruction on how to use the system for recognition. Users can upload an image of a traffic sign from the file explorer and wait for a few seconds to get the result. The system processes the image internally with the help of a machine learning model; the model predicts the label of that particular image and prints the name of the matched title. The uploading of just one picture at a time is possible for users. The system also contains a contact form where users can give feedback or suggestions about anything related to the traffic sign system, the webpage, or any problem they face while using this web app. This system may be beneficial for students also. They can get knowledge about traffic rules and types of traffic signs. They can even upload an image of a traffic sign to get the name of traffic signs. The system is user-friendly and accessible.
1.4.3. Subsystems
1.4.3.1. Image Upload module
This sub-system gives the basic information of the system where users have to upload an image and go through further processing. With changes in lighting conditions, these useless interference zones will have a greater impact on traffic sign identification, increasing the computational complexity of the training network and the rate of traffic sign misrecognition. As a result, image preparation is required.
Methodology: Scrum
Planning: Use case Diagram, Activity Diagram
Design tools: Figma (UI/UX)
Programming Language: Python
Python Framework: Flask (Frontend & Backend) Coding tools: Visual Studio Code
Test plan: Usability testing
1.4.3.2. Traffic sign recognition module
This is the main sub-system of this project which addresses the academic questions as it helps in recognizing the traffic sign. For this process, several photos are chosen at random from the testing set samples and preprocessed before being fed into the trained network model. The network model outputs the recognition results, displaying the meaning of traffic signs with the highest likelihood.The statistical recognition results are achieved by comparing the output results to the real reference meanings.
Methodology: Scrum
Design tools: Figma(UI/UX)
Frontend and Backend Development: Flask
Data Requirement: a dataset of pre-collected traffic signs data Development tools: Visual Studio Code, Jupyter Notebook Image classification: Convolutional Neural Network (CNN) Test Plan: Usability testing, Unit testing
1.4.3.3. Traffic Rules and Types module
This sub-system provides the general information which would be knowledge-improving factors for an individual about traffic signs. Traffic signs can be categorized as regulatory, warning, and guide signs. Regulatory signs are often used to inform drivers of their rights and responsibilities. A number of the most typical regulation signs, such as the Stop Sign, and Speed Limit Sign, are likely to be seen on any given route. Drivers are alerted to an unexpected or dangerous road condition or traffic situation with warning signs. This means that misinterpreting a warning sign can be deadly.
Some examples of warning signs are curved with a speed limit, reverse turn, one-way, etc. Travelers can get mileage and directional information from guide signs. They’re usually green with white text, although they can be any color. Highway routes, mile markers, exit and entry signs, etc are some examples of guide signs.
Design tools: Figma(UI/UX)
Development tools: Visual Studio Code Frontend and Backend Development: Flask Test tools: Usability testing
1.4.3.4. Information Management Module
This subsystem deploys a contact form that includes a name field, email field, and messages field. Users can send their queries and system-related questions through the contact form. The messages are stored in the database. The database used here is ‘MySQL’ and in this system, the database is only used for the contact form. The information is stored in the proper format. The information is only accessible by the developer or admin of this system. The information stored in the database can be used for further different work such as advising traffic police about traffic signs, working on awareness programs on the topic of traffic signs and their impact, etc.
Design tools: Figma (UI/UX)
Planning: ER Diagram
Development tools: Visual Studio Code Frontend Development: Html, tailwind CSS Backend Development: Flask
Database: MySQL
1.5. Academic Question
How can AI and machine learning help to assist in safe driving practices and enhance safety in complicated traffic signals?
1.5.1. Explanation of Academic Question
Nowadays we can see many road accidents happening day by day. There are many reasons for that accidents, but one of them is not recognizing traffic signs properly. There are many easily understandable traffic signs, but some are very complicated to understand, and even we don’t know their name. These types of traffic signs do not show any impact on a general people, but they impact the safe driving practices of drivers. As a result, drivers compromised their safety and lost their lives without proper signs of recognition. So I have made a system that solves this problem by helping in recognizing traffic signs. Hence I have a made a question that gives the information about both the problem and solution and the question is How can AI and machine learning help to assist in safe driving practices and enhance safety in complicated traffic signals?
1.6. Scope and limitation of project Scope of project
A project aims to create a system that can recognize and classify road and traffic signs to develop an inventory to help transportation authorities update and maintain traffic signs. It will also enable users to enhance safe driving practices and drive accordingly. Educational materials like users can get to know the several traffic rules and about different types of traffic signs. But said, like this, users will recognize all the traffic signs, so those project developers clarify that they will have the scope that will allow recognizing all the possible traffic signs. The project’s content will be raised according to the context within the report, but there arises a problem of limitations that are mainly not specified by projects.
Limitations of project
A project owner allows one user to use its system to check whether all the things that are said initially are completed or not. The project has certain scope. Will all scopes succeed or not? there always arises a problem that problem is limitations. Some of the limitations of the project are mentioned below:
- Since the system is about recognizing the traffic signs but it recognizes even the image different than traffic signs.
- If the faded image or image has a different background color, it will recognize it but give the wrong name of traffic signs.
- The system will not be able to detect the labeled class name if the image have been have a value of transparency.
1.7. Report Structure
Table 3 Report Structure
Elements Explanation
| Title page | This section includes the project title and information about the student and his/her supervisor and reader. |
| Table of contents | It includes the information about every heading and subheading of several aspects like page number, indexing, etc |
| Introduction | This section includes project briefing, overall working system information, problem domain, and its solution. This section also includes the information on AI implementation i.e. machine learning and algorithm used etc.It also includes the main aspect of the project or system i.e, Aims, objectives, and most importantly Academic Questions and their explanation. |
| Literature Review | It includes the research papers about the similar system or AI algorithm which are going to be implemented in this system. |
| Project Methodology | It includes the way of doing our project, and which methodology we are going to use for the system like scrum, waterfall, etc. |
| Tools and Technology | It includes the programming language and where do we code of backend and frontend and which tools like Github, we are going to use for updating progress. |
| Artefacts Design | It includes the design of every subsystem like the use case diagram, activity diagram, wireframe, ERD diagram, sequence diagram, etc. it also includes the testing part of the system. |
| Conclusion | It includes all the answers to aims, objectives, and especially academic questions. |
| Critical evaluation | It includes the good and bad aspects of the development of the system. |
| Reference and bibliography | It includes references to all the research we have done throughout the project. |
| Appendices | It includes the extra information about the system like the user manual, system configuration, etc |