
THEORY:
A graph of cumulative value of any hydrological quantity generally as an ordinal plotted against time is known as hydrology . The mass curve may be caused as a flow mass curve or simply a mass curve. It is the integration of hydrography from one time to another.
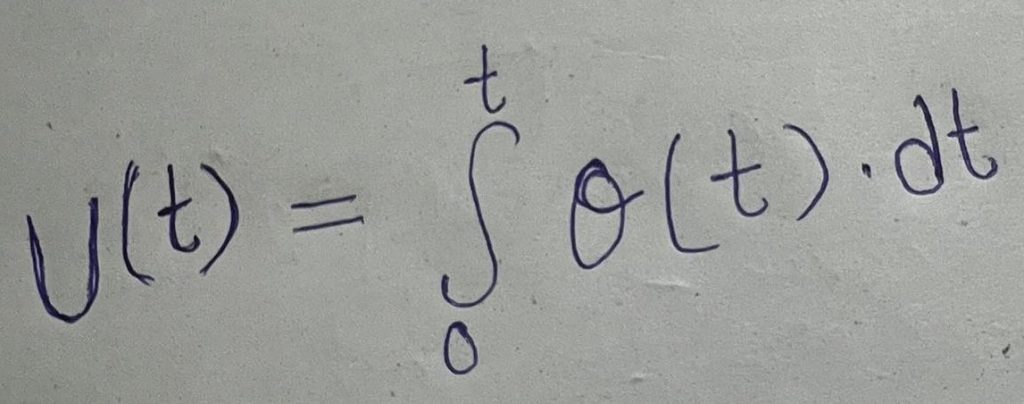
Where,
U(t)= cumulative vol. Of flow upto time
g(I)= The discharge as a function of time
T= Variable
The unit of flow mass curve is a million meter cube (mm3). Mass curve is also known as ripple curve or ripple diagram.
It is used to solve the river’s problems of determining the maximum demand rate that can be maintained by given storage volume mass.
PROBLEM NO.1
Draw a mass of given two years monthly runoff of a river and determine the avg supply .
| S.N. | Months | Runoff(m3) | Cumulative runoff(mm2) |
| 1 | January | 58 | |
| 2 | February | ||
| 3 | March | ||
| 4 | April | ||
| 5 | May | ||
| 6 | June | ||
| 7 | July | ||
| 8 | August | ||
| 9 | September | ||
| 10 | October | ||
| 11 | November | ||
| 12 | December | ||
| 13 | January | ||
| 14 | February | ||
| 15 | March | ||
| 16 | April | ||
| 17 | may | ||
| 18 | June | ||
| 19 | July | ||
| 20 | August | ||
| 21 | September | ||
| 22 | October | ||
| 23 | November | ||
| 24 | December |
CALCULATION:

=(611-58)/24-0
= 21.91mm3
RESULT:
A mass curve of given two years I and II monthly runoff of a river into the reservoir in cumulative runoff. Monthly was plotted in graph and hence, the average supply to water wawa 21.91.
CONCLUSION:
Hence, the flow mass curve was constructed by the graph of given two year data.