APPARATUS REQUIRED
i) Graph paper
ii) Notebook
iii) Quadrat
iv) Pencil
THEORY
The structure and composition of plant communities Can be studied qualitatively by observing each and every individual of plant species growing in a particular habitat. As counting of plant species of the whole area is not possible, random sample areas are identified from different places within the study area of a particular habitat for the rough estimate of species content. This sampling is done by using a geometric system of vested plots of different sizes. When a graph of no of species is found in plots against the sample plot size, a small quadrat plot will be determined by locating the point on the curve where horizontal live starts and joining it to the horizontal axis.
PROCEDURE
First of all, the study area was selected. In the study area, the square quadrat of area (10×10)cm2 was thrown randomly in that area. The various species present within the area were wasted. This area was increased to 460 cm² with the same quadrant and the no.of species present in that area was noted. Thus, the area of the quadrat goes on increasing axel the number of species fill there was no further increase in the total no. of species with increasing size of quadrat.
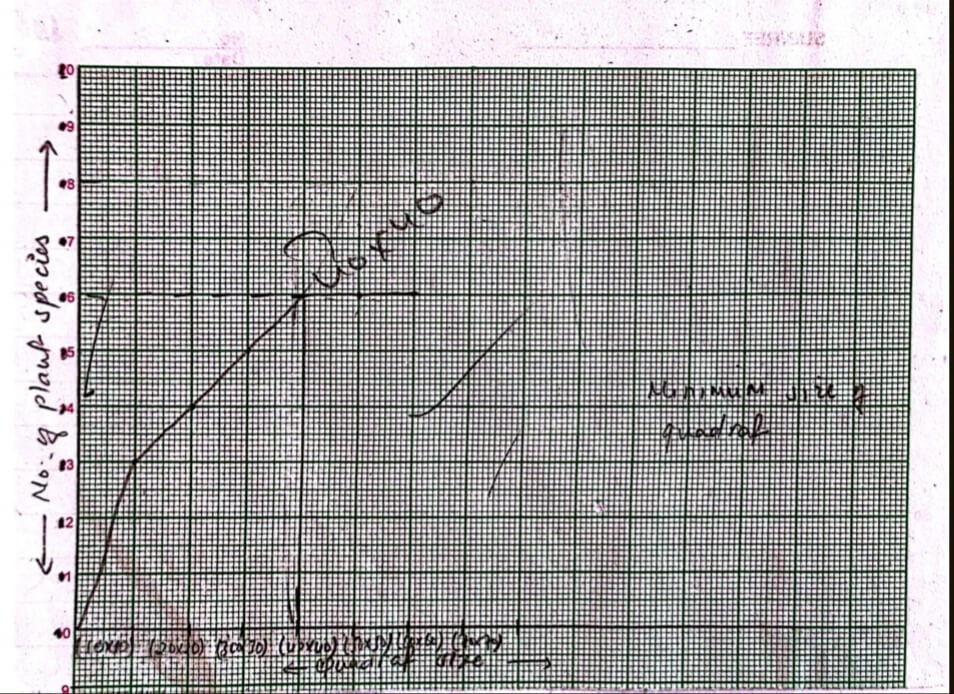
Now, the graph paper was taken and the no. of species was plotted against the quadrats area on the x-axis. The point of which the curve starts flattening was noted. From this point the area of quadrat was found. This was taken as the minimum size of the quadral to be taken for further study.

OBSERVATION
The graph showed the no. of increasing species as the increase of quadrat size then started Flattening forming a species area curve line in graph paper from the point of curve started flattening a horizontal line was drawn toward X-axis and pointed vertically downward to meet the axis.
OBSERVATION TABLE
| S.N. | Area of quadrat | Total no. of plant species present | Remarks |
| 1. | (10×10)cm²= 100cm² | 4 | |
| 2. | (20×20)cm²= 400cm² | 5 | Minimum size |
| (30×30)cm²= 900cm² | 6 | of quadrat is | |
| (40×40)cm²= 1600cm² | 8 | (40×40)cm² | |
| (50×50)cm²= 2600cm² | 8 |
RESULT
Thus, it was found that the minimum size of a quadrant was (40×40)CM².
CONCLUSION
Hence we can find the minimum size of quadrat by area curve method.
