APPARATUS REQUIRED
i) Quadrat
ii) Graph paper
iii) Notebook
iv) Pencil
THEORY
In the community, the plant species are unevenly distributed, somewhere in wide space and in other in clumps depending upon their reproductive capacity and adaptability to the environmental frequency in number of sampling unit or quadrats in which a given species in terms of percentage Therefore, the frequency of plant species is studied by sampling the study area wing any desired quadrat sampling method of several place and counting the names of individual plant present within each sample ares. The percentage of frequency of plant species can be estimated by using the formula:
% frequency (F) = no. quadrant in which the species occurred/Total no of quadrat studied x 100
Relative frequency (R.F) = Frequency of individual species/total frequency of all species x100
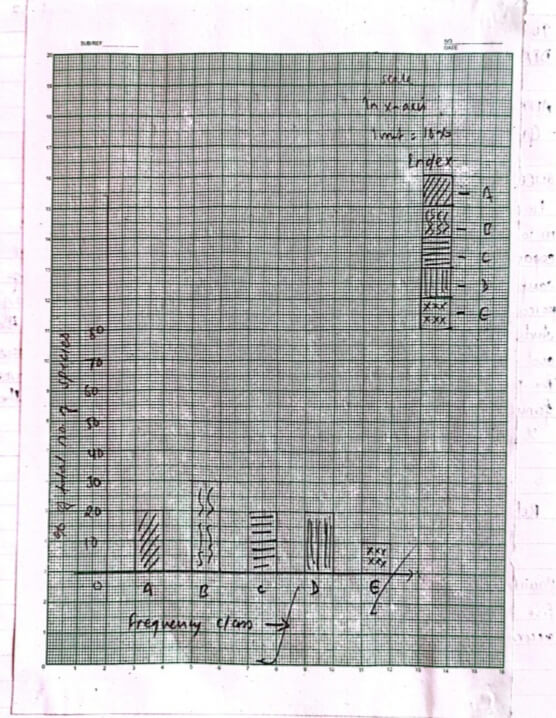
Raunkiaer (1934) classified the species in the community into the following five classes as shown in the table. Classes of species in community according to Rounkiaer (1934)
| Frequency class | % frequency |
| A | 1-20% |
| B | 21-40% |
| C | 41-60% |
| D | 61-80% |
| E | 81-100% |
Arrange percentage frequency of different species of the above table in the five frequency classes (A-E) as formulated by Raunkiaes (1934).

PROCEDURE
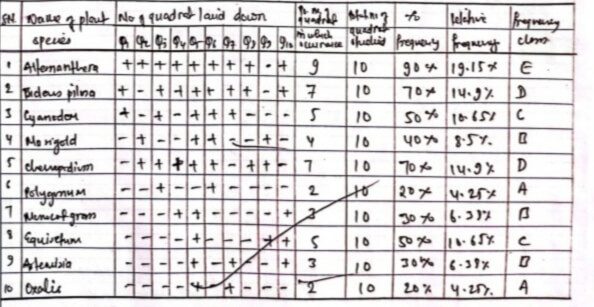
A specific area to be studied was selected, and a quadrant was laid there. The plant species observed was noted. At least two quadrats were laid in the same manner and recorded the data in the observation table.
OBSERVATION TABLE

