APPARATUS REQUIRED
i) Pencil
ii) Quadrat
iii) Notebook
THEORY
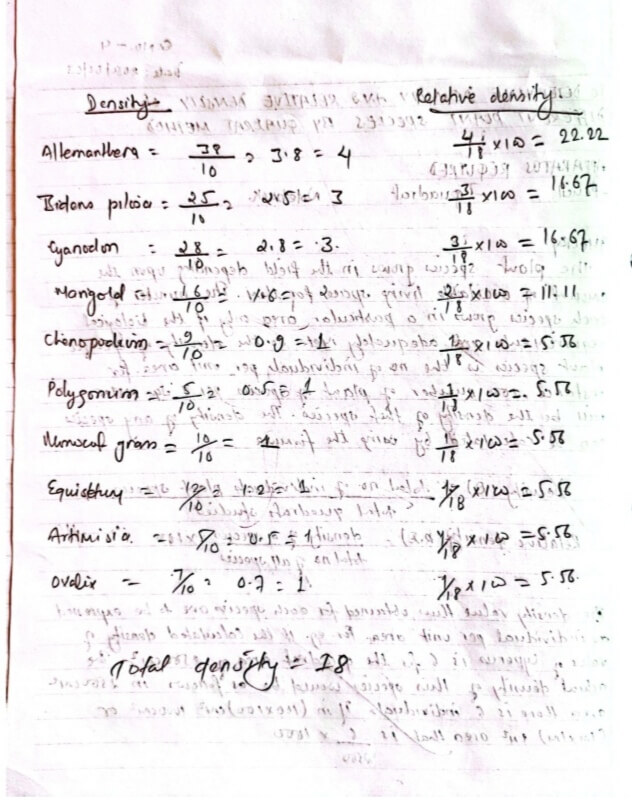
The plant species grows in the field depending upon the amount of available living space for them. The number of each species grows in a particular area only if the biological requirements are adequately met. So the density of specific plant species is the number of individuals per unit area, for instance, 100 plant species per 1 sq. Meter will be the density of that species. The density of any species can be calculated by using the formula :
Density (D) = total no of individuals plant species/total quadrats studied
Relative density (R.D) = density of a species/total number of all species x100
The density values thus obtained for each species are to be expressed as individual per unit area. For. eg. if the calculated density of value of Cyperus is 6 for the quadrat area of 2500cm². The actual density of this species would be as follows in 2500cm² area there is 6 individuals of in (100×100) cm² 1000cm² or (1mx1m) 1cm² area that is 6/2500 x1000
That means the density of individuals in 100x100cm² area is called standard density. Thus, the density of Cyperus is expressed as 6 per sq.m instead of 1.

PROCEDURE
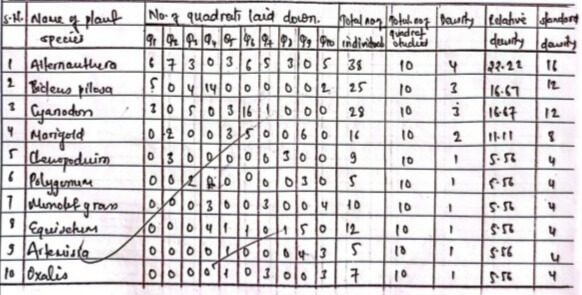
The specific area to be studied was selected and quadrats were laid there. The plant species observed was noted. At least 10 quadrats were laid in same manner and recorded data were filled in observation table.
OBSERVATION TABLE

Total density = 18
RESULT
In terms of density and relative density the field was dominated by Alternanthera.
CONCLUSION
Hence the density and relative density of plant species can be determined by the quadrat method.
